When a client recently asked us if the investment climate had improved in India, we became curious ourselves and decided to dive in. Having lived through a tortuous investment climate for international investors in the telecom sector between 2009 and 2013, I knew first-hand that there were deep structural issues that could not be fixed within one-term of a business-friendly administration.
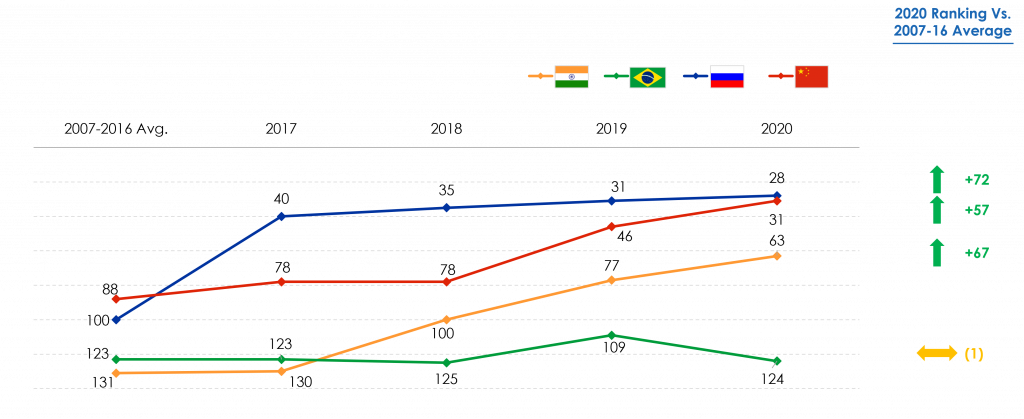
As we dug in, the first thing we came across was effusive praise in both the domestic and international media for the remarkable progress India had made in the Ease of Doing Business (EODB) ranking released by The World Bank Group annually. India had historically been in the bottom third of countries with an average ranking of 131 between 2007 and 2017. Since Prime Minister Narendra Modi made EODB improvement a key platform to communicate to the world that India was open for business, several reforms have been undertaken. The series of reforms have landed India on the top-10 improved list for 3 years in a row and it has risen from a lowly 130th in the 2017 report to 63rd in the 2020 report published in Oct 2019.
Can the EODB ranking be gamed?
Like with any metric, it pays to understand the methodology and potential drawbacks. We found the EODB metric deficient in 4 ways:
- The World Bank Group accounts for data only from 2 metropolitan areas for the major economies and in most cases, this is not representative of the business climate across the country. Depending on the source and methodology, Delhi and Mumbai only represent 8-10% of India’s GDP and 3% of its population
- The methodology attempts to measure the business environment for domestic firms and entrepreneurs and does not account for additional regulations and roadblocks that might apply to international investors and foreign firms
- The magnitude of the informal economy and widespread corruption is not fully accounted for in the ranking either. The International Labor Organization estimates 81% of India’s employed are in the informal economy and Transparency International ranks India 78th in Corruption Perceptions
- Many of the metrics measured (construction permits, registering property) do not reflect the shift to the knowledge / gig economy. One can only hope that in time communications infrastructure, data protection and privacy etc. will be incorporated
“Despite all these drawbacks, we believe EODB is the most comprehensive metric available over a long time series to a) compare like-for-like economies and b) measure their progress over time.”
3HA
“Despite all these drawbacks, we believe EODB is the most comprehensive metric available over a long time series to a) compare like-for-like economies and b) measure their progress over time.”
3HA
Where does India stand relative to its peers?
In the global race of foreign direct investment and human capital, India’s performance needs to be measured against two groups, other BRIC economies and the G7. While many of the Asian tigers also compete with India for investments and innovation, none of them quite compare in scale and so we did not include this group of countries.
Among BRIC economies, Russia and China had a significant head start, and their average rank between 2007-2016 was 31 and 43 spots higher than India respectively. Furthermore, they have been on a mission to address the EODB ranking for longer. This said, as shown in Figure 1, since the 2017 report, India has closed the gap by nearly half with these countries.

Figure 1: EODB ranking for BRIC countries
Sources: The World Bank Group, 3HA Research & Analysis
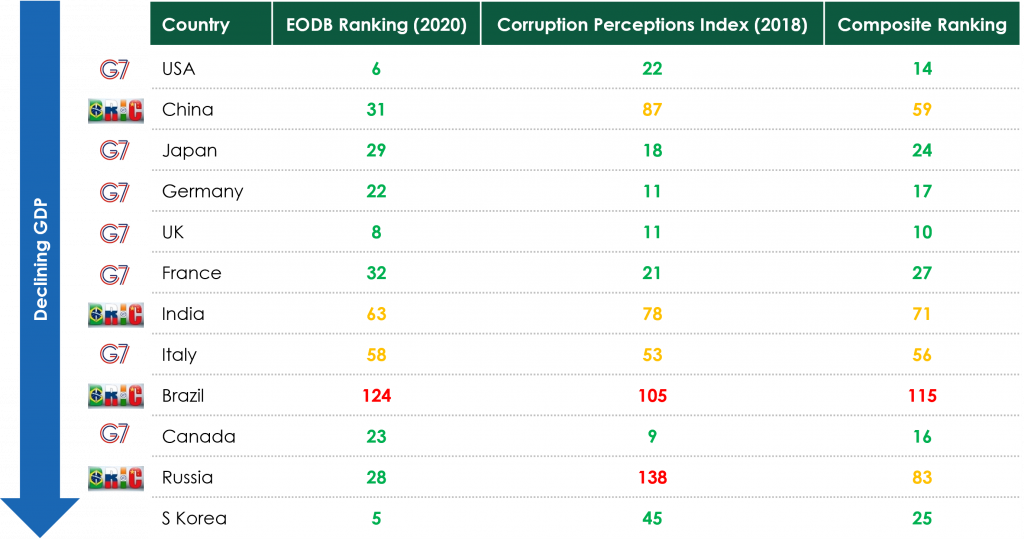
While this progress is remarkable among this peer group, there is still a huge gap with the G7 economies. Italy is the only country among the G7 economies that is not in the top quartile in EODB rankings and the average rank of G7 economies is 24. As shown in Figure 2, after considering the Corruption Perceptions Index (CPI), the gap widens between the G7 economies and the BRIC countries. One can also see the lack of transparency and perceptions of widespread official corruption in Russia makes that economy relatively unattractive for international investors.

Figure 2: Composite ranking of top-12 economies accounting for EODB and corruption perceptions
Sources: The World Bank Group, Transparency International, 3HA Research & Analysis
Has the EODB improvement had an impact?
The World Bank Group posits that as economies make progress on EODB, the level of entrepreneurial activity and employment accelerate and one can also argue, this could catalyze foreign direct investment. Greenfield FDI in India as measured by FDi Intelligence spiked in 2015 and 2016 to become the #1 global destination with greenfield investments surpassing $60B each year, likely driven by the optimism on the back of the country electing a “business-friendly” leader. However, as shown in Figure 3, this dropped dramatically in 2017 driven in part by the high degree of uncertainty created by poor implementation of 2 major initiatives:
- Demonetization, when high value bills, worth 90% of the cash in circulation were banned almost overnight ostensibly to curtail tax evasion and official corruption
- Introduction of a nationwide Goods and Services Tax (GST), meant to replace a patchwork of local tax regimes
2018 saw a rebound along with a rebound in global FDI, but India garnered 225 bps less as a share of global greenfield FDI vs. the high watermark from 2015 and 2016.

Figure 3: Greenfield FDI in India and share of global FDI
Sources: FDi Intelligence (Financial Times’ specialist unit dedicated to FDI), GEM report by Global Entrepreneurship Research Association, 3HA Research & Analysis
Similarly, when it comes to entrepreneurship, the data is disappointing with India’s Total early-stage Entrepreneurship Activity (TEA) as measured by the Global Entrepreneurship Research Association. While it shows a meaningful increase to 11.4% in 2018 from 9.3% in 2017, this comes on the back of a decline from 10.9% in 2015. Additionally, India’s TEA is significantly lower than global averages, especially for factor-driven economies.
Where do we go from here?
Coming back to India’s telecom industry, on October 24th 2019, ironically on the same day the World Bank released of the 2020 EODB report, India’s Supreme Court ruled in favor of the regulator expanding the definition of revenue to include rent, device sales etc. The private sector had been battling the government on this issue since 2004 (you read that right, this had been ongoing for 15 years during which time many international telcos came and went after writing off billions of dollars of investments!). To add insult to injury, the Supreme Court instructed the telcos to clear the dues of nearly $20B within 3 months. This might just be the death blow for an industry already laboring under the burden of $100B+ in debt.
Martin Peters, the ex-CEO of Vodafone India said it best last week.
“For most foreign investors, it has been like a bad dream… The Indian telecom market has developed in a very negative way for investors.”
“For most foreign investors, it has been like a bad dream… The Indian telecom market has developed in a very negative way for investors.”
In summary, while the data shows that headline EODB rankings have improved remarkably, India remains a bureaucratic morass and more work is needed to improve its global competitiveness. Specifically, we’d argue the following:
- Regional and local regulations and policies also need a major overhaul
- The judicial branch remains hostile to business and needs to be addressed
- Rooting out corruption is a colossal undertaking, but needs to be addressed nevertheless
And in keeping with the aspirational goals India’s leader routinely sets for the nation, we’d suggest the following goals:


