Is the democratization of Private Equity a recipe for mediocrity?
After a record shattering year for US PE, we took a look at what might be in store for the industry both in the near-term and farther out and how some of the industry players are preparing for threats that loom on the horizon and adapting to the evolving environment.
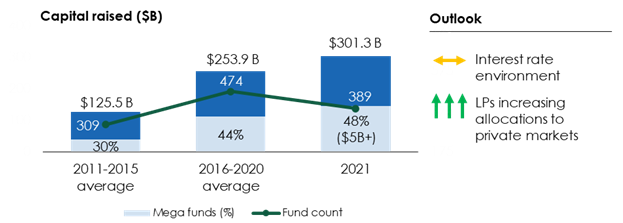
Figure 1: U.S. PE fundraising activity
Note: Fundraising totals exclude co-investment capital
Sources: PitchBook, 3HA Research & Analysis
While the headline on the fundraising front has been all about mega funds ($5 billion+) garnering a lion’s share of all PE capital raised with a sub narrative that the environment is challenging for smaller funds, deeper data analysis does not bear this out. While mega funds accounted for 45% of all US PE raised in the 2019-2021 timeframe, this is not a new phenomenon. In fact, these funds had a higher percent of total funds raised in 2016-2017 (46%+) and 2007-2008 (56%). At the same time, funds under the $1 billion threshold raised $63.7 billion in 2021, the 2nd highest total ever and 32% higher than the prior 10-year average. In terms of the number of sub-$1 billion funds, 305 funds raised capital in 2021 compared to a 10-year average of 283. We believe that the fundraising environment remains conducive for funds of all sizes and stripes.
Massive distributions in 2021 combined with many LPs increasing their allocations to private markets, in some cases by 50% over previous levels, imply that the good times will continue to roll. We do not believe that the rising interest rate environment will meaningfully impact US PE fundraising. However, it is likely to influence the deal activity, exit multiples, and future returns.
PE dealmaking in the US outpaced the GDP of all but 15 countries
PE dealmaking in the US outpaced the GDP of all but 15 countries
Now looking at the deal activity, in 2021 PE dealmaking in the US outpaced the GDP of all but 15 countries, at over $1.2 trillion. This was 62% higher than the previous record set in 2007 before the global financial crisis. Everyone involved in the PE value chain had a very busy year with 8,624 completed deals, 50% higher than the prior record set in 2019. A confluence of factors continued to push up the deal multiples with the median US PE buyout multiples at an all-time high at 13.7x. However, the debt taken to close deals has been trending down in recent years compared to previous cycles, reducing the likelihood of companies remaining saddled with crushing debt. There was no shortage of opportunities to invest, but increasing competition and rising deal prices increases the odds of missteps.
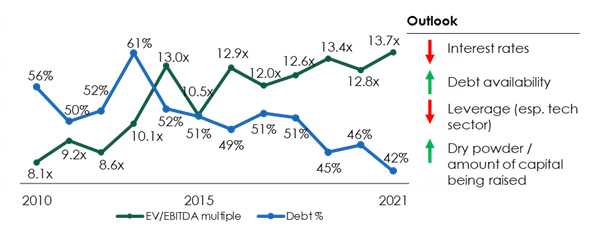
Figure 2: Median U.S. PE buyout metrics
Sources: PitchBook, 3HA Research & Analysis
The record high deal multiples will demand substantial growth in portfolio company earnings. This will in turn exert intense pressure on post transaction value creation activities and act as a dampener on long-term PE returns. In the near-term, PE firms might respond by scrutinizing deals more closely, be more disciplined about valuing targets, and investigate portfolio companies’ ability to pass on soaring input costs.
When it came to exiting investments and distributions back to LPs, 2021 again was a record breaking year. Number of exits was 32% higher than the prior record and total exit value was a whopping 107% higher than the prior record, both set in 2018. The average exit value approached $500M, driven in large part by lofty transaction multiples. The evolving macro environment, zealous M&A scrutiny by regulators across jurisdictions, and geopolitical uncertainties are likely to have the greatest impact when it comes to exit activity.
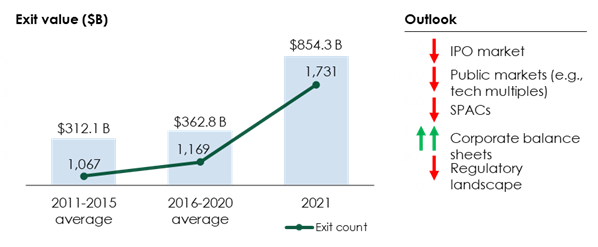
Figure 3: US PE exit activity
Sources: PitchBook, 3HA Research & Analysis
When it comes to performance, especially compared to public markets, the golden age for PE ended in the early 2000s. A highly “accommodative” monetary policy beginning with the global financial crisis has resulted in a sharp rise in public equity valuations. This alongside intense competition for private companies has diminished PE fund outperformance.
More recently, after hiccups during the early COVID-19 period, US PE funds have registered healthy performances. As of June 30, 2021, the one-year IRR for US PE funds was an astronomical 56.2%. A record year in terms of exits and unrealized returns aided by lofty public market multiples have boosted this metric. To make a more apples-to-apples comparison, we looked at an alternate metric, PME or public market equivalent against the Russell 3000 index. Figure 4 shows the PME since 1997 and while it is clear that PE has outperformed public markets, net of fees during this entire time period, the margin of outperformance has declined precipitously over time.
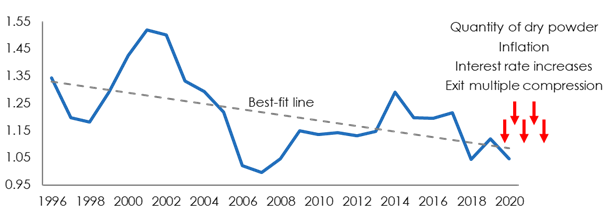
Figure 4: Kaplan-Schoar PME vs. Russell 3000 index
Sources: PitchBook, 3HA Research & Analysis
Historically, EBITDA growth has driven over 50% of the total change in enterprise value and significantly more than either multiple expansion or balance sheet leverage. With record high deal multiples and an anticipated compression in public equity multiples, PE firms will have to lean that much more heavily into EBITDA growth for any chance at reclaiming historical performance. With a flood of new money coming into PE, this task will be that much more challenging. LPs will be watching closely whether returns in the coming years meet expectations and whether they should reverse their higher allocations!


